
I fasted for 21.5 hours and had a blood sugar reading of 73 mg/dL immediately before I broke the fast. I then ate two medium hard-boiled eggs, about 75 grams of boiled whole wheat bulgur, a sandwich and Jimm’s coffee. My glucose rose to 115 mg/dL after one hour and 130 mg/dL after two hours, making 130 mg/dL my highest recorded reading.
Then I did something that added another useful data point. At the two-hour mark, I went for a one-hour walk. When I tested again after walking, roughly three hours after eating, my glucose was 123 mg/dL.
That 73 mg/dL starting point is one of the main things I want to pay attention to. It was my baseline after a fairly long fast, and everything that happened afterward can be compared with it.
This is still one personal experiment. I am documenting what my meter showed, not claiming that this meal, fasting duration or walking routine would produce the same result for someone else.
Quick Results
| Time | My glucose | Change from baseline |
|---|---|---|
| Before eating, after 21.5-hour fast | 73 mg/dL | Baseline |
| 1 hour after eating | 115 mg/dL | +42 mg/dL |
| 2 hours after eating | 130 mg/dL | +57 mg/dL |
| After a 1-hour walk, about 3 hours after eating | 123 mg/dL | +50 mg/dL |
My highest recorded reading was 130 mg/dL at two hours, which was 57 mg/dL above my starting point.
My 73 mg/dL Baseline After a 21.5-Hour Fast
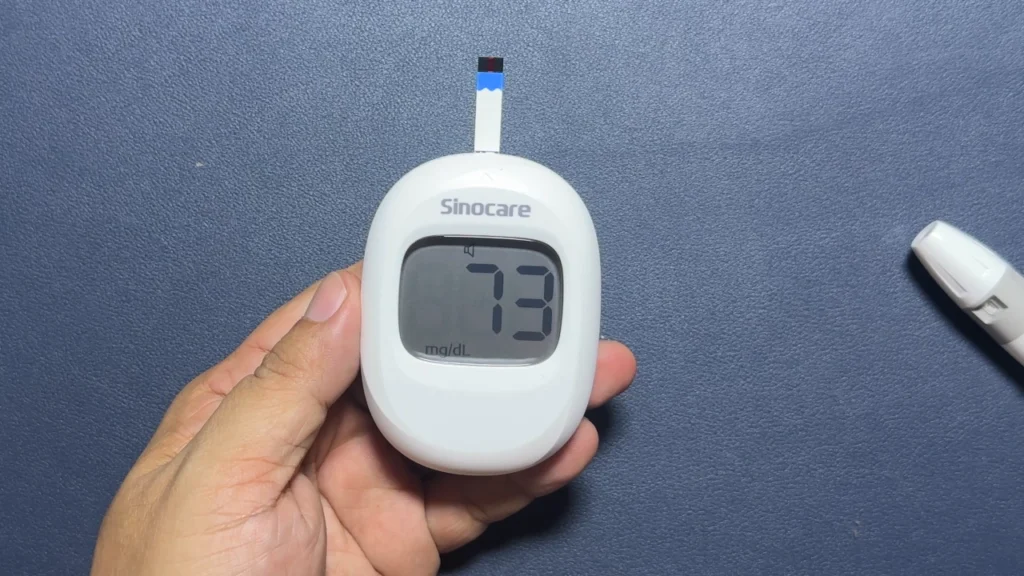
I started fasting at 7:00 PM on August 31 and broke my fast at 4:30 PM on September 1. That works out to exactly 21.5 hours.
There is one distinction I want to make about the 73 mg/dL reading. I don’t know that my glucose stayed at 73 mg/dL for the entire 21.5 hours because I wasn’t measuring it continuously. What I know is that after 21.5 hours without food, my finger-stick reading immediately before eating was 73 mg/dL.
That makes 73 my baseline for this experiment.
It also makes the later numbers easier to put into perspective. One hour after the meal, I was 42 mg/dL above baseline. At two hours, I was 57 mg/dL above baseline. After the walk, I was still 50 mg/dL above baseline.
The size and timing of those changes are more useful to me than looking at any one reading by itself.
Why I Usually Break My Fast Around 4:30 to 5:00 PM
The timing of this experiment also comes from my normal work schedule.
I have a daytime job that ends at 4:00 PM. My trip home usually takes about 25 minutes, so realistically, the earliest I can normally sit down and break my fast is around 4:30 PM. Sometimes it ends up closer to 5:00 PM.
That is why many of my longer fasts naturally finish in that part of the afternoon. On this particular day, I broke the fast at 4:30 PM.
My previous meal had been chicken, rice and vegetables. During the fasting period, I had water and unsweetened black coffee.
I had also slept 7 hours. It was a normal workday with moderate stress.
What I Ate When I Broke the Fast
My first meal after the fast was a mixed meal rather than a test of one food by itself.
I ate two medium hard-boiled eggs, about 75 grams of boiled whole wheat bulgur, a sandwich and Jimm’s coffee.
That matters when I interpret the readings.
The eggs, bulgur, sandwich and coffee were all part of the same meal. I didn’t record the exact carbohydrate content of the sandwich or the composition of the Jimm’s coffee, so I can’t calculate the total carbohydrate load. I also can’t look at the numbers afterward and identify which food produced which part of the response.
My Glucose Kept Rising Through the Two-Hour Reading
My meter showed 73 mg/dL before eating.
After one hour, it was 115 mg/dL.
Instead of being lower at the next test, my two-hour reading was higher at 130 mg/dL. That was the highest number I recorded and represented a 57 mg/dL increase from where I started.
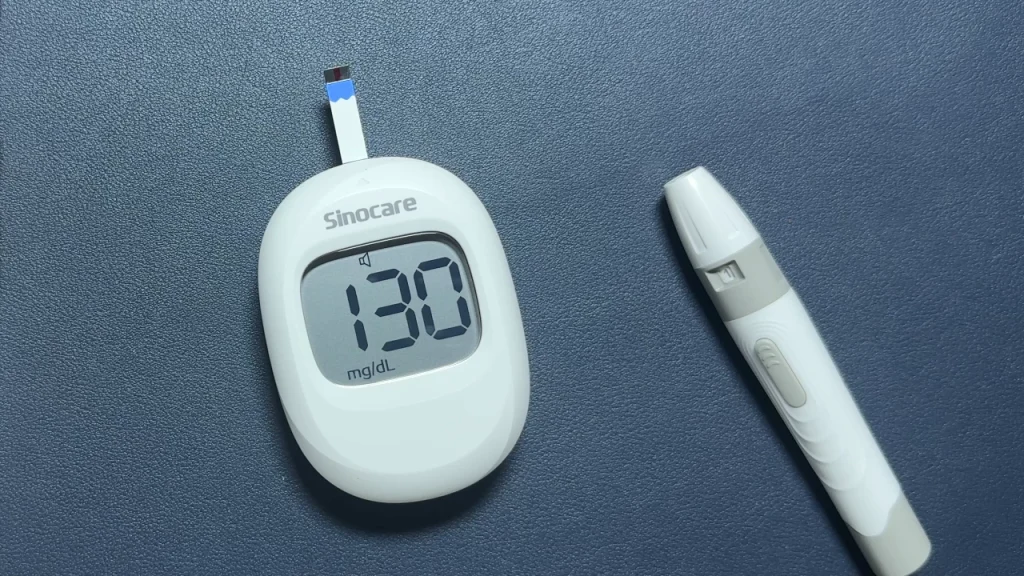
I have a theory about this.
After going 21.5 hours without food and reaching a baseline of 73 mg/dL, I wonder whether my body responded differently when I suddenly ate a meal containing carbohydrates. In my own shorthand, I think of this as being especially “sensitive to carbs” when I broke the fast.
But that is a theory, not something this test proved. I did not measure insulin, and I did not eat the same meal after a shorter fast for comparison. A glucose meter alone cannot tell me whether my insulin sensitivity was higher or lower.
There is research showing that longer periods without food can change fuel use and the glucose response when food is reintroduced. The studies do not reproduce my exact 21.5-hour experiment, though, so I can’t use them to explain my result with certainty.
What Happened After My One-Hour Walk
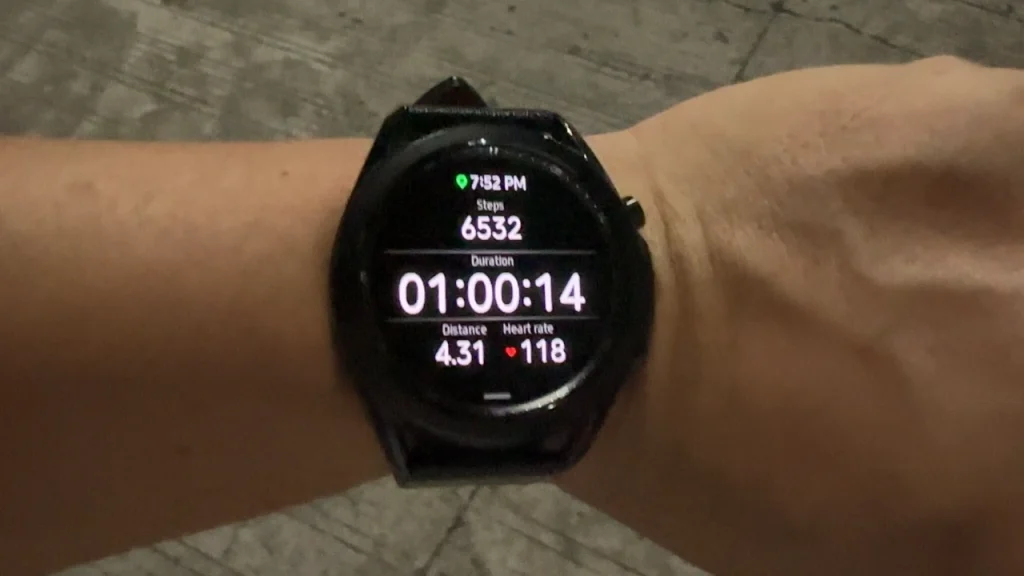
Two hours after breaking my fast, with my meter reading 130 mg/dL, I went for a one-hour walk.
After the walk, roughly three hours after the meal, I tested again.
123 mg/dL.
That was 7 mg/dL lower than the two-hour reading, but still 50 mg/dL above my original 73 mg/dL baseline.
I can’t say that walking caused the seven-point drop. By then, another hour had passed since the meal, and glucose could already have been moving downward. Home glucose meters also have measurement limitations.
What the extra test does tell me is that my glucose hadn’t returned close to my starting point by the time I finished walking.
My Theory About the Bulgur and the Three-Hour Reading
Bulgur is the part of this meal I’m most curious about.
My theory is that the bulgur may have contributed to the longer post-meal pattern. Because bulgur is a less-refined wheat product with its grain structure more intact than many refined wheat foods, its digestion and glucose response can differ from foods such as white bread. Research on bulgur has also found that its glycemic response depends on the product, processing and preparation.
So when I saw 123 mg/dL at around three hours, I wondered whether I was seeing a slower decline partly because the bulgur was still being digested.
Again, I can’t establish that from this experiment.
The sandwich was another carbohydrate source, and the eggs made this a mixed meal containing protein and fat as well. Mixed meals can behave differently from an isolated serving of carbohydrate because the combination of nutrients can change the timing of digestion and glucose absorption.
On top of that, I walked for an hour before taking the 123 mg/dL reading.
There are simply too many variables here to give bulgur all the credit for the shape of the curve. But it gives me a question worth testing more carefully later.
How I Felt During the Experiment
I rated my hunger 5 out of 10 before eating. I was hungry before the meal and felt full afterward.
My recorded energy afterward was 7 out of 10.
Those subjective notes don’t tell me what my glucose was doing, but I want to keep recording them alongside the numbers. Two experiments with similar glucose readings could still feel very different.
What This Experiment Actually Tells Me
The clearest finding is the pattern I measured.
After a 21.5-hour fast, my starting glucose was 73 mg/dL. It increased to 115 mg/dL after one hour and 130 mg/dL after two hours. After another hour that included a one-hour walk, it was 123 mg/dL.
What the experiment cannot tell me is why.
I can’t separate the effect of fasting duration from the bulgur, sandwich, eggs, coffee, walking, stress or normal meter variation. I also don’t know what my glucose did between those measurement points.
And because I only did the experiment once, I don’t yet know whether this is a repeatable response for me.
What I Will Test Next: A Similar Fast After Only 2 Hours of Sleep
My next experiment will focus on one factor that was very different on this test: sleep.
I had seven hours of sleep before this experiment. Next time, I want to fast for almost the same length of time but test after getting only about two hours of sleep.
That comparison interests me because controlled sleep-restriction studies have found changes in insulin sensitivity even after short periods of reduced sleep. Those studies do not tell me what my own glucose will do after two hours of sleep, which is exactly why I want to compare my readings.
I will be looking closely at the pre-meal baseline as well as the one-hour and two-hour readings. If possible, keeping the fasting duration, meal and measurement schedule similar would make the comparison more useful.
There will still be limitations. Two hours of sleep could affect more than glucose handling. It could also change stress, hunger, energy and my normal activity that day.
So I won’t treat a different reading as proof that sleep alone caused it. What I want is another real data point to compare with this one.
Bottom Line
After fasting for 21.5 hours, my glucose immediately before eating was 73 mg/dL. After eggs, about 75 grams of bulgur, a sandwich and coffee, it reached 115 mg/dL at one hour and a highest recorded reading of 130 mg/dL at two hours, 57 mg/dL above baseline.
After walking for one hour, my next reading was 123 mg/dL at roughly the three-hour mark. I have two working theories: the long fast may have affected how I responded to the carbohydrate-containing meal, and the bulgur may have contributed to the longer glucose pattern. This experiment can’t prove either one, so the value for me is in using these readings as a reference for more controlled comparisons.
Disclaimer: This article documents my personal experience and is not medical advice. Home glucose meters and continuous glucose monitors have limitations, and one person’s results should not be used to predict another person’s response or make treatment decisions. Consult a qualified healthcare professional about personal glucose readings or health concerns.